
Kaltura Video Analytics Provides the Answer
Are your students watching your lecture videos? Are they watching the entire video? Are you sure?
Analytics lets you see who is watching your videos and for how long.
Analytics
Kaltura Video Analytics creates viewership data of media in the My Media section of eLearning@UNG (D2L).
How to Access Analytics
1 – Log in to eLearning@UNG.
2 – Click the My Media link.
3 – Click the video’s title.
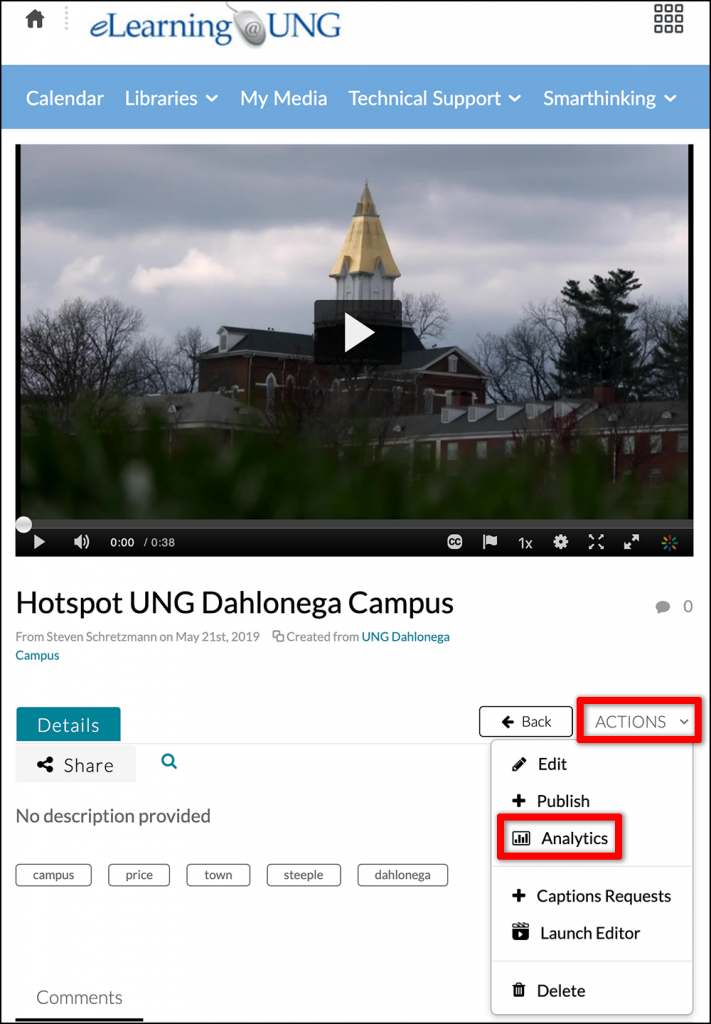
4 – Click the Actions link under the video player.
5 – Click the Analytics link in the menu.
This opens the “Analytics for media” dashboard.
How to Use Kaltura Video Analytics
The “Analytics for media” page is an overview that shows how many times the video has been played, the average view time, and how much of the video was played during the last 30 days (the default setting).
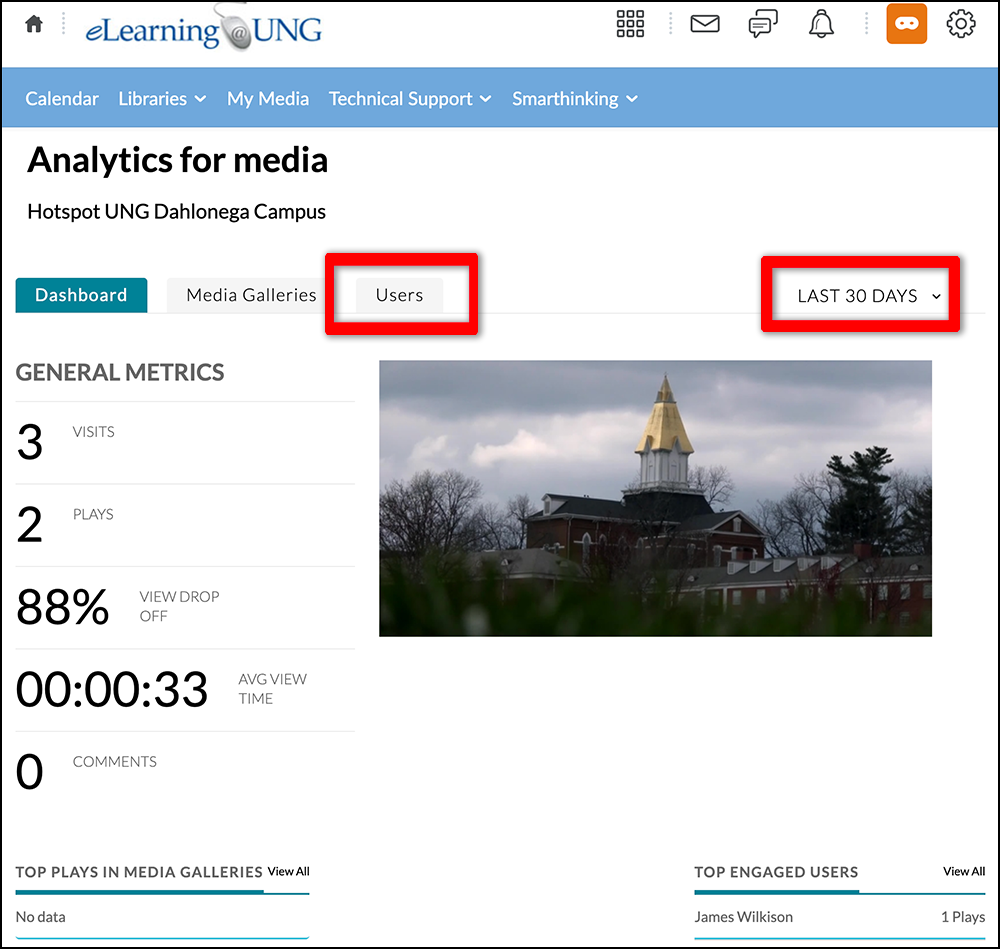
5 – Click the LAST 30 DAYS tab and filter for 120 or 365 days. Use the Custom link to filter for a range of dates.
6 – Click the Users tab to view statistics for individual viewers.
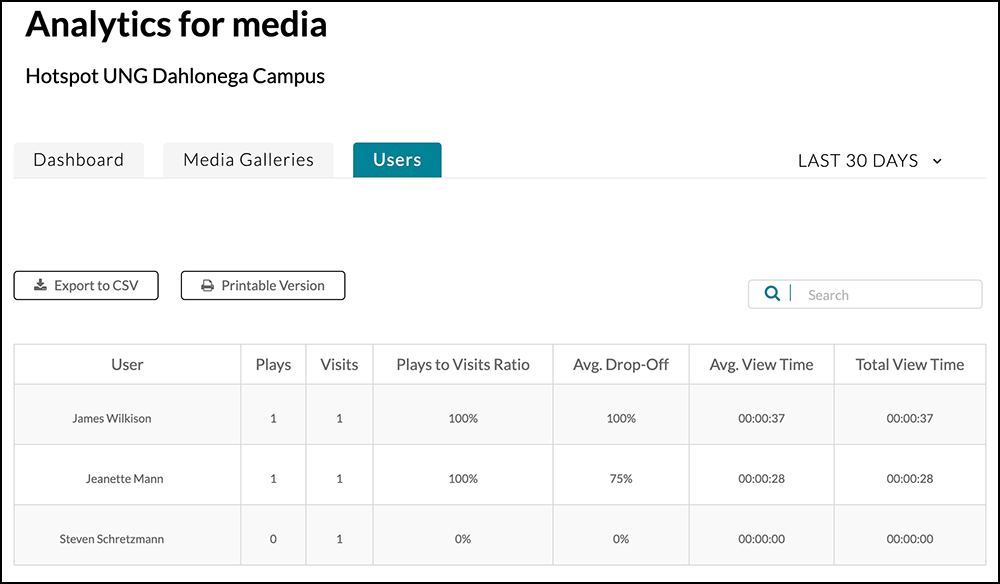
The “Users” page shows statistics for all users during the last 30 days (the default setting). Search for a student, filter for a time period, download the information to a spreadsheet, or print it.
Definitions
- Plays – the number of times the video was played
- Visits – the number of times a video page was visited
- Plays to Visits Ratio – percentage of times a user played a video during all visits
- Avg. Drop-Off – the average percentage of video watched before the user closed the page
- Avg. View Time – the average amount of time the video was watched
- Total View Time – the total time the video was played
- View drop off – the average percentage of how much of a video was watched